Reading:
- Power Tools by Steven Strogatz (New York Times)
- Hughes-Halett 1.1, 1.2, 1.3, 1.5, 1.6, 1.7, 1.9, 1.10, 8.1, 8.2
- StartR 1, 2.1, 2.2, 2.3
- Design of Learning Environments
Lessons (Asterisk indicates there is a checkpoint quiz in Moodle):
- Introduction to Functions*: Screencast – Slides
- Linear Functions*: Screencast – Slides
- Exponential and Log Functions*: Screencast – Slides
- Proportionality and Power Functions*: Screencast – Slides
- Periodic Functions*: Screencast – Slides
- Functions of Multiple Variables*: Screencast – Slides
- Starting with RStudio: Screencast
- Creating and Graphing Mathematical Functions in R: Screencast
- Making Scatterplots from Data in R: Screencast
- Graphing Functions of Two Variables in R: Screencast
Practice problems:
- 1.1.8, 14, 24
- 1.2.8, 27, 33
- 1.3.7, 10, 36, 45
- 1.5.5, 8, 13, 29
- 1.6.22, 26
- 1.7.5, 16, 24
- 1.9.4, 8, 16, 21
- 1.10.10, 11, 17, 30
- 8.1.2, 5, 16
- 8.2.2, 28
- Answer key
Activities:
- R notes
- Linear functions and modeling
- Working with exponential models (key)
- Periodic functions worksheet (key)
- Contour plots in real life
- Thickness of Earth’s crust
- Sea surface temperature
- Body Mass Index from article
- Topographical map
- pH of acid rain
- Sulfur dioxide on the island of Hawaii
- Strength of a radio signal
- Ozone depletion
- Mona Lisa
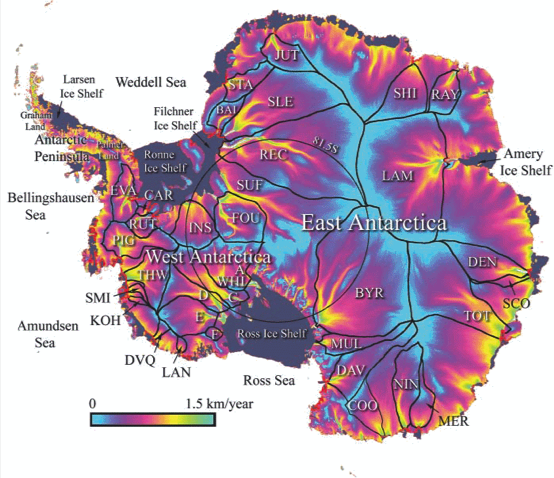
- Antarctic ice flow speed from article
- Tornadoes in Texas from article
- Thunderstorm days per year from article
- Temperature at North Pole from article
- Noisy events near airport from article
- Practice with contour plots (key)